
Must Be 21 To Enter
By entering this site you are agreeing that you are at least 21 Years of Age or older.
I AM 21 OR OLDERUnlock Your Ideal High with This Cannabis Effects Chart 2026
.svg)

.png)
You're standing in front of a menu that looks simple at first, then suddenly it doesn't. One flower name says relaxation, another says focus, a third promises creativity, and the THC numbers climb fast enough to make you second-guess everything. That's exactly where a cannabis effects chart helps, because it turns a crowded dispensary shelf into something you can read with confidence.
At Mr. Nice Guys DC, the smartest shoppers don't start with strain hype. They start with the experience they want, the time they have, and the amount of risk they're willing to take on. A good chart gives you that framework, so you're not guessing your way through flower, vapes, edibles, tinctures, or topicals.
Your Guide to Navigating Cannabis Choices
A lot of people walk into a dispensary with the same goal in mind. They want relief, better sleep, or a calmer evening, but the menu can feel like a codebook, and every product seems to promise something different. A cannabis effects chart helps turn those product names into likely experiences instead of marketing slogans.
The most useful charts do not pretend every product hits the same way. They help you connect onset, duration, dose, and the effect you want. Cannabis can affect memory, learning, attention, judgment, coordination, emotion, and reaction time, so the chart should help you think beyond “strong” or “weak” and toward “what do I need this to do for me?” Health Canada factsheet on cannabis health effects
Practical rule: if you know your goal before you shop, the chart becomes a shortcut, not a guessing game.
For a new patient, the first question is usually simple. Do you want something that comes on fast and clears relatively quickly, or something that builds slowly and lasts longer? That choice changes the whole shopping experience, especially with products like inhaled cannabis and edibles, which behave very differently in real life.
A simple example makes the difference clearer. If someone wants a short evening session after dinner, a fast-onset product may fit better than an edible that lingers deep into the night. If they want something they can take once and not think about again, longer-lasting formats may make more sense. The chart is there to help you make that choice before you buy, not after you have already taken too much.
At Mr. Nice Guys DC, that same framework helps people sort through options without getting stuck on strain names alone. The right choice usually starts with the experience you want, then moves to the product type that matches it. A chart gives you a practical way to compare those options side by side, so you can shop with more confidence and less second-guessing.
What Really Drives Cannabis Effects
Cannabis doesn't work like a one-note switch. Think of it more like an orchestra, where THC is the conductor, CBD helps balance the tempo, and terpenes add the character that makes one product feel different from another. That's why two items with similar THC numbers can still feel noticeably different in the body and mind.
THC potency is often grouped into bands, and those bands give you a practical starting point. One reference maps less than 2% THC to non-psychotropic effects, 12% to 17% to moderate to strong effects, and 20%+ to very strong effects. It also notes that most legal flower falls in the 10% to 30% THC range, with 20% often used as a common high-potency benchmark, while concentrates can reach 60% to 90% THC. THC percentage level chart

That's why a chart based only on strain names can mislead people. A flower at the same THC band as another flower may still feel calmer, brighter, or more focused depending on its broader chemical profile. If you want a deeper look at how those aromatic compounds fit into the picture, Mr. Nice Guys DC has a plain-English breakdown of what terpenes in weed actually do.
Reading the orchestra in a real purchase
A shopper who wants a softer evening might look for a product that sits in a lower or moderate THC band instead of jumping straight to the strongest number on the shelf. Someone seeking stronger intoxication may look toward higher-potency flower or concentrates, but that doesn't automatically mean a better experience.
A useful way to think about it is this:
- THC sets the intensity: higher potency usually means a stronger psychoactive ceiling, especially if you're not tolerant.
- CBD can soften the edges: many people use it to balance the feel of THC, though the experience still depends on dose and product type.
- Terpenes shape the vibe: the aroma isn't just scent, it often helps explain why one product feels more grounding and another feels more upbeat.
People often ask for “indica” when they really want calm, or “sativa” when they really want energy. Those labels can help as rough shorthand, but they're not a substitute for reading the product's cannabinoid and terpene profile. A chart gives you a better vocabulary than strain folklore.
How Consumption Method Changes Everything
A shopper can choose the same flower, THC band, or brand and still have a very different experience depending on how it is taken. That is the part a cannabis effects chart needs to show clearly, because inhaled products, edibles, tinctures, and topicals all move on their own schedule.
The comparison is easy to understand once you separate speed from duration. Inhalation works like a quick sprint, edibles move more like a slow train, and tinctures usually land somewhere between the two. Topicals sit in their own lane, since they are often used for local relief rather than a full intoxicating effect.
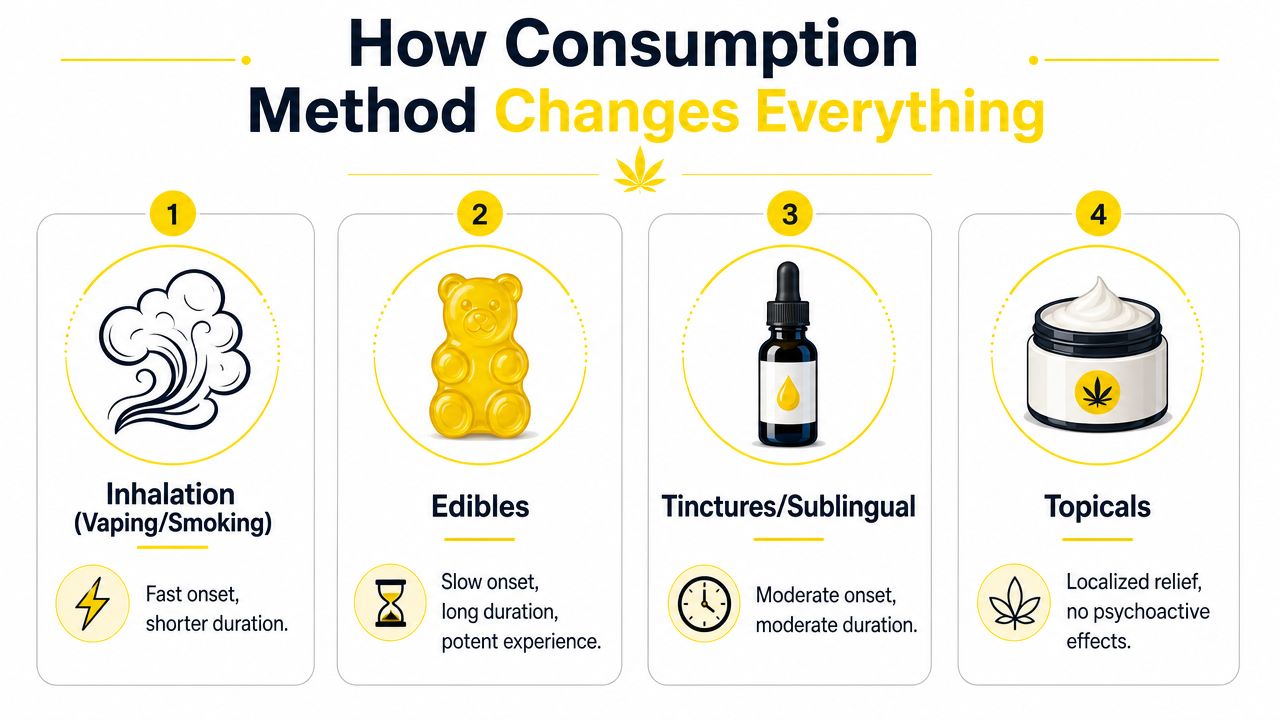
Northwestern's harm-reduction guide explains that inhaled cannabis often peaks around 10 minutes and lasts 1 to 3 hours, while edibles usually peak around 2 hours and can last up to 24 hours. That gap helps explain why a new user can take an edible, feel little at first, then end up stronger than intended once the full wave arrives. Northwestern's harm-reduction guide
For shoppers who want a practical side-by-side breakdown, Mr. Nice Guys DC also has a clear guide to edibles vs vapes vs flower.
Matching method to your day
- Inhalation: best for people who want fast feedback and a shorter session.
- Edibles: better for people who want a slower build and a longer stretch of effects.
- Tinctures: useful when someone wants a non-smoked option with more control than a full edible.
- Topicals: usually fit people looking for localized use rather than intoxication.
That route-based difference matters more than many beginners expect. Health Canada notes that inhaled cannabis can take effect in seconds to minutes, while edible or drinkable cannabis can begin in 30 minutes to 2 hours, with effects that can last much longer than people often expect. That timing changes how you shop, how you wait, and how you decide whether to take more.
If you need relief before a commute, a meeting, or a short errand, choose a form that lets you predict the peak instead of hoping for the best.
How to Read and Use an Effects Chart
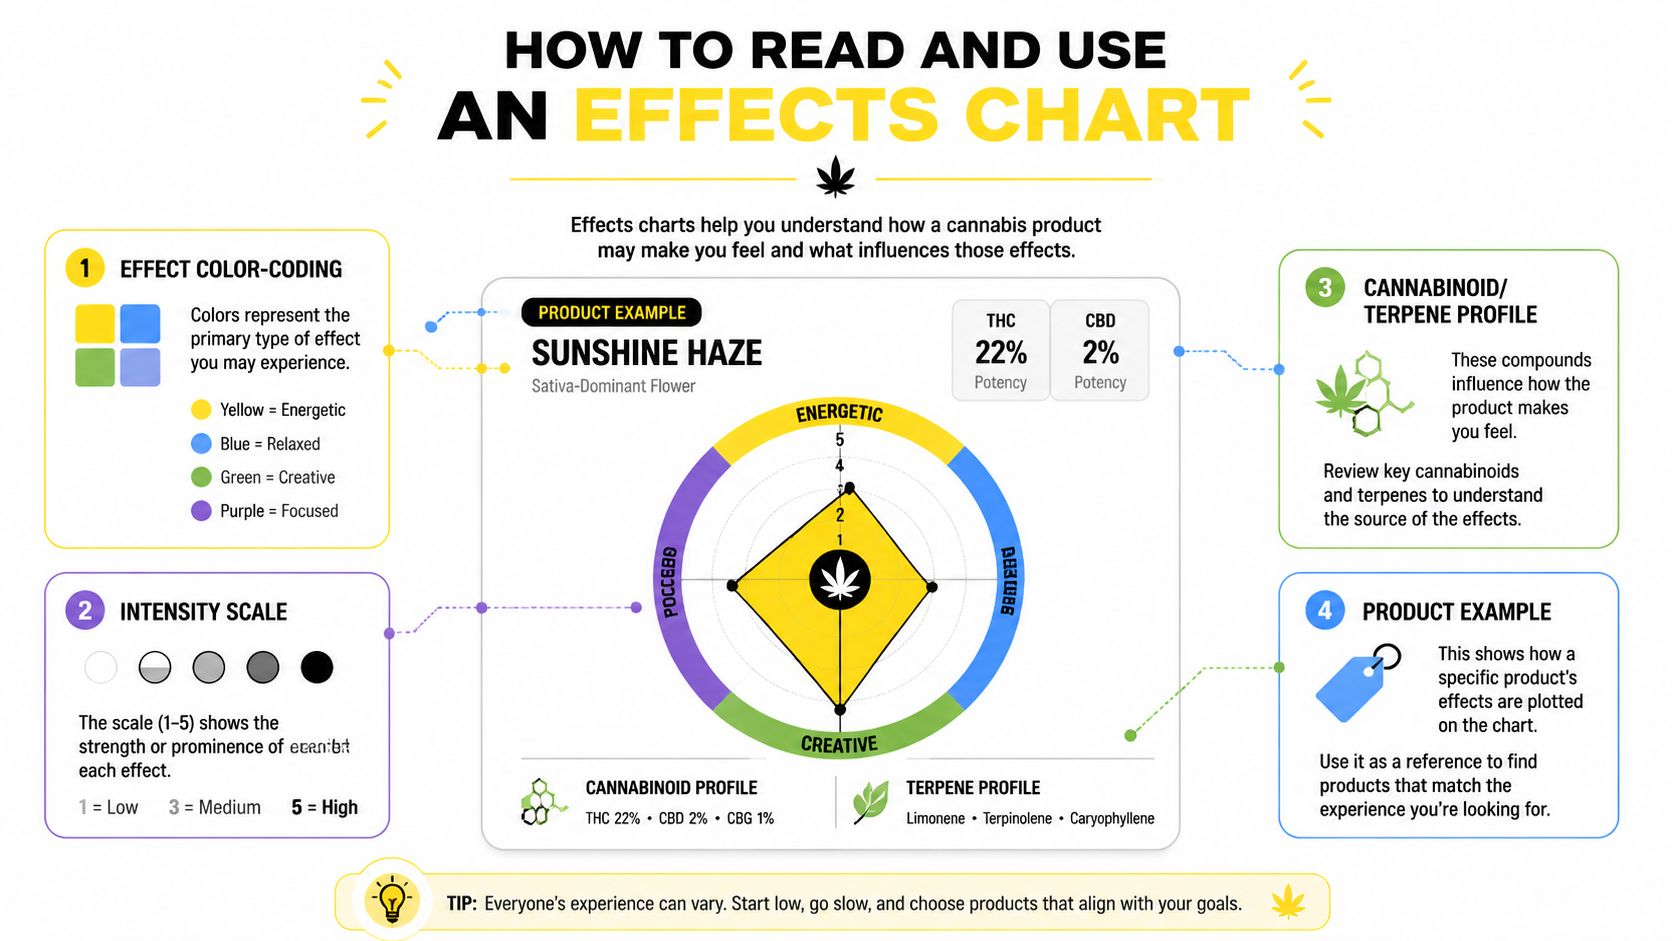
A good chart should feel more like a map than a label. You are not trying to memorize cannabis science on the spot, you are trying to match a product to a mood, a timeline, and a tolerance level. That is why the most useful charts break effects into categories like energy, calm, focus, creativity, and body feel instead of treating everything as one general high.
Most readers do better when they look for three things at once. First, the effect labels show what kind of experience a product is likely to support. Second, the intensity scale shows how pronounced that effect may be. Third, the cannabinoid and terpene profile helps explain why it may land that way.
A chart becomes much easier to use when you read it like a weather report. You are not asking, “Is this good or bad?” You are asking, “What conditions is this likely to create for me?” That shift is important because cannabis can affect judgment, memory, attention, and coordination, which makes the chart a safety tool as well as a shopping aid. U.S. government fact sheet on marijuana effects
A simple way to interpret the visuals
If a chart uses colors, treat them as shorthand, not universal truth. Yellow might point to energetic effects, blue to relaxed effects, green to creative effects, and purple to focused effects. The exact color system can vary by brand, but the idea stays the same, which is to help your eye move quickly across choices without needing a chemistry degree.
A product tag often gives away more than the strain name. If it shows a strong body effect, a moderate euphoria score, and a terpene profile built around a calming note, that product may fit an evening better than a workday. If the chart also shows fast onset, you can plan the timing around that.
Mr. Nice Guys DC's cannabis potency testing overview helps when you want to compare lab results with what you see on an effects chart.
What to look for before you buy
- Effect profile: identify whether the product leans calm, uplifting, creative, or sedating.
- Intensity scale: decide whether you want a mild, moderate, or stronger experience.
- Route of use: match the product to how fast and how long you want effects to last.
- Safety context: think about driving, work, sleep, or social plans before selecting a product.
Modern charts are useful because they reflect route and timing, not just product names. Inhaled cannabis can take effect in minutes, while edibles can begin in 30 minutes to 2 hours and last much longer than many people expect, so a chart that ignores that difference leaves out the part people feel most directly. Health Canada factsheet
Dosing Tolerance and Safety First
An effects chart tells you what a product might do. It does not tell you how your body will respond the first time, because tolerance changes the picture quickly. A new consumer and a daily consumer can look at the same edible and have very different experiences.
A sensible starting point is to keep the first dose small. One widely cited guideline says first-time or low-tolerance consumers should start with no more than 5 mg of THC, and that taking a whole 10 mg edible at once instead of splitting it can lead to anxiety or disorientation. THC dosage guidance
The most common mistake is impatience. People eat an edible, do not feel much, and take more too soon. That is how a controlled evening turns into an unexpectedly strong one, especially because edible effects build slowly. A cannabis effects chart helps here only if you use it as a starting point and match it with your own tolerance, not with wishful thinking.
Use the chart as a personal baseline
Practical rule: if you are unsure, treat the chart as a starting point and your first session as a test, not a target.
Tolerance also shifts with routine use. A product that once felt strong may later feel manageable, and that is why experienced consumers often read a chart differently than beginners do. If you use cannabis often, your personal version of the chart will look different from the printed one.
For people who want a clearer starting point with edibles, Mr. Nice Guys DC has a straightforward edible dosage calculator. It is a useful way to sanity-check your dose before you buy.
Safety matters just as much as comfort. Short-term cannabis use can affect coordination, problem-solving, and memory, which is why it is smart to avoid driving or operating machinery after use and to choose products carefully when you have to stay sharp.
A few habits that keep the experience manageable
- Read the serving size: the label matters as much as the milligrams.
- Wait before redosing: especially with edibles, give the product time to show you its full effect.
- Store products securely: keep them away from kids, pets, and anyone who should not consume them.
- Plan your environment: a calm setting helps you read your own response more clearly.
The safest shopping mindset is simple. Start low, go slow, and do not confuse a strong number with a better result.
Choosing Your Product at Mr Nice Guys DC
Once you understand the chart, shopping gets a lot easier. Instead of asking for a random strain and hoping it works out, you can walk in with a clear goal, like “I want something calming but not overwhelming” or “I need a fast-acting option for after work.” That gives the team something specific to match you with, which is a much better starting point than strain mythology.

If you're shopping for gentle relaxation, look for products that land in the calmer part of the chart and don't jump straight to the highest potency label on the menu. A low-dose edible may make sense if you want a longer session, while flower or a vape may fit better if you want a quicker start and an earlier finish. The right answer depends less on the strain name and more on the timeline you're trying to control.
Mr. Nice Guys DC's menu includes curated flower, cartridges, edibles, pre-rolls, concentrates, topicals, and tinctures, so you can choose by effect and format instead of by guesswork. That's where a cannabis effects chart becomes practical, because it helps you decide between a discreet vape, a slower edible, or a non-inhaled tincture before you ever reach the counter. If you want a broader menu tour, their guide to what cannabis products are available at Mr. Nice Guys DC is a useful companion.
A few shopping examples that make the chart real
A patient who wants to sleep better may start by looking for a calm, body-forward profile and a product that won't peak too late in the night. Someone who needs discreet relief during a busy day might prefer a fast-acting inhaled option so they can predict how long the session lasts. Another person who avoids smoking altogether may lean toward tinctures or edibles, depending on how long they want the effects to stay with them.
The shop's ordering options also matter. In-store pickup works well if you want to talk through the chart in real time, curbside helps if you already know what you want, and delivery can be a convenient option for people who'd rather plan ahead from home. The same chart still applies, you're just using it in a different setting.
The safest choice is usually the one that matches both the experience you want and the amount of time you have to recover from it. If you need to drive, work, or stay mentally crisp, the chart should steer you toward the least impairing option that still fits your goal. That's the primary advantage of shopping with a chart in hand.
Find Your Perfect Match with Confidence
A cannabis effects chart takes the mystery out of the menu. When you know how dose, route, timing, and potency work together, you can shop with purpose instead of pressure. That makes every purchase easier to understand, whether you're looking for calm, focus, relief, or just a more predictable evening.
The best part is that you don't have to decode it alone. With the right chart and a clear goal, you can walk into Mr. Nice Guys DC ready to choose a product that fits your life, not just your curiosity. That's how cannabis education turns into a better buying experience.
A CTA for Mr. Nice Guys DC.
Mr Nice Guys DC
At Mr. Nice Guys DC, we’re more than just a cannabis delivery service — we’re passionate advocates for quality, convenience, and community. With years of experience in the cannabis industry, our team is dedicated to educating and empowering customers across Washington, D.C. Whether you're a seasoned user or just starting your cannabis journey, our blog delivers trusted tips, product insights, and the latest updates from the world of weed. Stay informed, stay elevated.
